


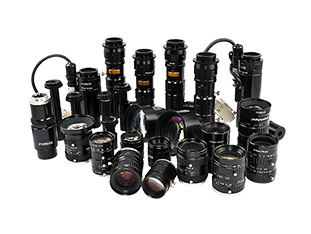
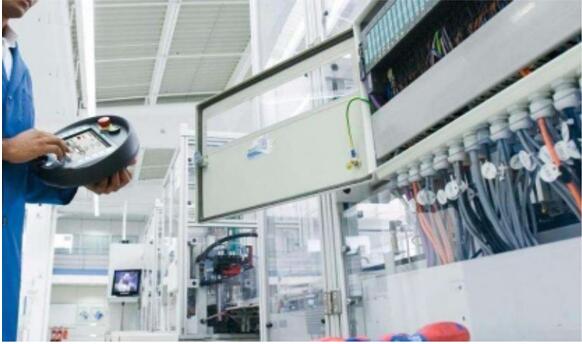
Industrial lenses are an important part of industrial inspection systems. In the design of industrial lenses, a variety of factors need to be considered, such as field of view size, depth of field, resolution, aberration and so on. In order to meet the demands of practical applications, industrial lenses are usually made of high-precision and high-stability materials to ensure the stability and durability of their performance.
MTF graph is a common tool used to evaluate the performance of an optical system, which can reflect the transfer function characteristics of the optical system. In the MTF graph, the horizontal coordinate indicates the spatial frequency and the vertical coordinate indicates the contrast. If the curve is closer to a straight line, it means that the transfer function of the industrial lens optical system is better, and the resolution and contrast are higher. If the MTF curve shows obvious depressions or bumps, it means that the optical system has problems such as aberration or chromatic aberration.
When viewing the MTF curve graph, you need to know some parameter information, such as field of view, aperture size, focal length and so on. These parameters will affect the shape and position of the MTF curve. It is also necessary to understand the test conditions, such as lighting conditions, test samples, etc. These factors will also have an impact on the shape and position of the MTF curve.
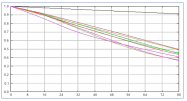
In the MTF curve graph, different positions of the curve correspond to different spatial frequencies. Generally speaking, MTF curves with low spatial frequencies correspond to the overall performance of the optical system, while MTF curves with high spatial frequencies correspond to the detailed performance capability of the optical system. Therefore, when analysing MTF curves, it is necessary to pay attention to the performance characteristics represented by the curves at different positions.
By comparing the MTF curve graphs of different models of industrial lenses, it is possible to assess the performance differences between different models. Generally speaking, the higher the MTF curve, the better the performance of the model, but it should be noted that different models of industrial lenses may have differences in testing conditions and aberration, etc., so it is necessary to evaluate the actual situation.
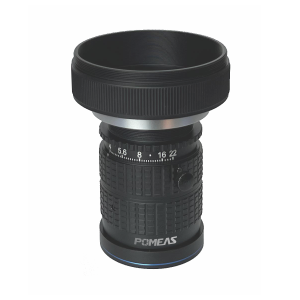
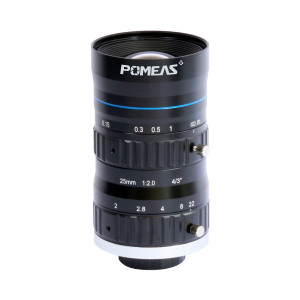
Product recommendation
TECHNICAL SOLUTION
MORE+You may also be interested in the following information
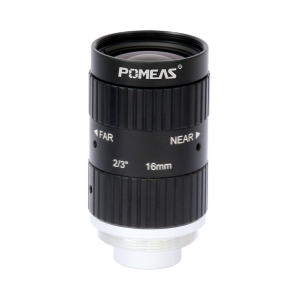
PMS-LLD033-14640M


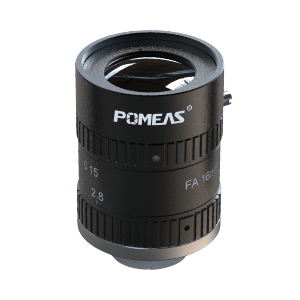
PMS-LLD025-8040M


FREE CONSULTING SERVICE
Let’s help you to find the right solution for your project!
 ASK POMEAS
  PRICE INQUIRY
  REQUEST DEMO/TEST
  FREE TRIAL UNIT
  ACCURATE SELECTION
 - APPICATION CASE
- RESOURCE CENTER
- DOWNLOAD CENTER
SOLUTIONS SUPPORT
- ZOOM LENS SELECTION TOOL
- TELECENTRIC LENS SELECTION TOOL
- FA LENS SELECTION TOOL
- ZOOM RATIO TABLE
- CERTIFIED MODEL
SELECTION TOOL
- WHY POMEAS
- FAQ
- PRIVACY POLICY
- TERMS OF USE
- DELIVERY & RETURN POLICY
CUSTOMER CARE
 ADDRESS
Add.:No.68, Yongwei Road, Baizhoubian, Dongcheng District, Dongguan, China,523000
CONTACT
 Tel:+ 86-0769-2266 0867
 Fax:+ 86-0769-2266 0867
 E-mail:marketing@pomeas.com

Wechat QR code
Software Copyright :2021SR0176001 抄袭必究, 技术支持:誉新源科技